

Prerequisite:
- Basic Understanding of Docker and Containerization
- Basic Understanding of Digital Ocean
- Intermediate-Level Understanding of Linux and the Command Line
- Have Helm, kubectl, doctl Installed.
Goals:
- Setup Prometheus
- Setup Grafana
- Setup AlertManager
Creating a Kubernetes Cluster
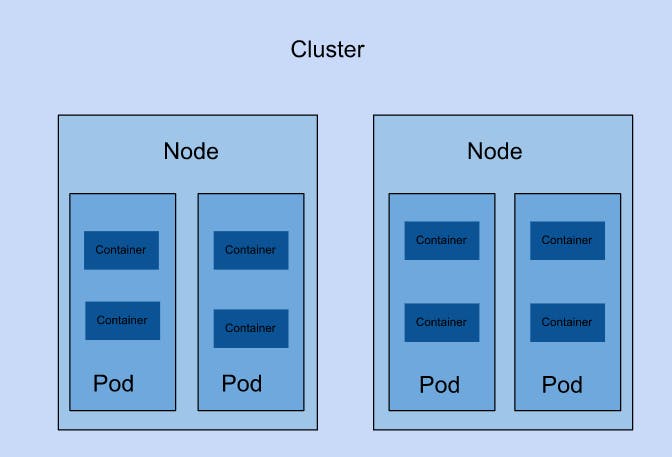
A Kubernetes cluster is a set of nodes that run containerized applications.
A Node is a physical or virtual machine in Kubernetes. Your local machine can be described as one node. Nodes contain pods while pods contain one or more containers. When a Pod runs multiple containers, the containers are managed as a single entity and share the Pod's resources.
Now we have described the basic architecture of a Kubernetes Cluster relevant to this article, we are going to monitor an already-running Kubernetes Cluster. This documentation contains information on how to get your first cluster up and running.
Once your cluster is up and running to confirm, run the command:
Kubectl get pods
This shows the status of the pods running on our kubernetes cluster. It should be ready and running.

Installing Prometheus, Grafana and Alertmanager
The helm package manager and kube-prometheus-stack is used in this article. An alternative will be to use Kubernetes Monitoring Stack from DigitalOcean’s Marketplace.
Create a namespace called article
Kubectl create namespace article

Kubectl get namespace
The first command creates a namespace called article while the second command shows you the list of namespaces. If all is right, you should see article in the list of namespaces.
Add and update the Prometheus repo
helm repo add prometheus-community https://prometheus-community.github.io/helm-charts
helm repo update prometheus-community
These commands adds the prometheus-community repo and updates it.
Install the helm kube-prometheus-stack
Navigate to the kube-prometheus-stack artifacts page
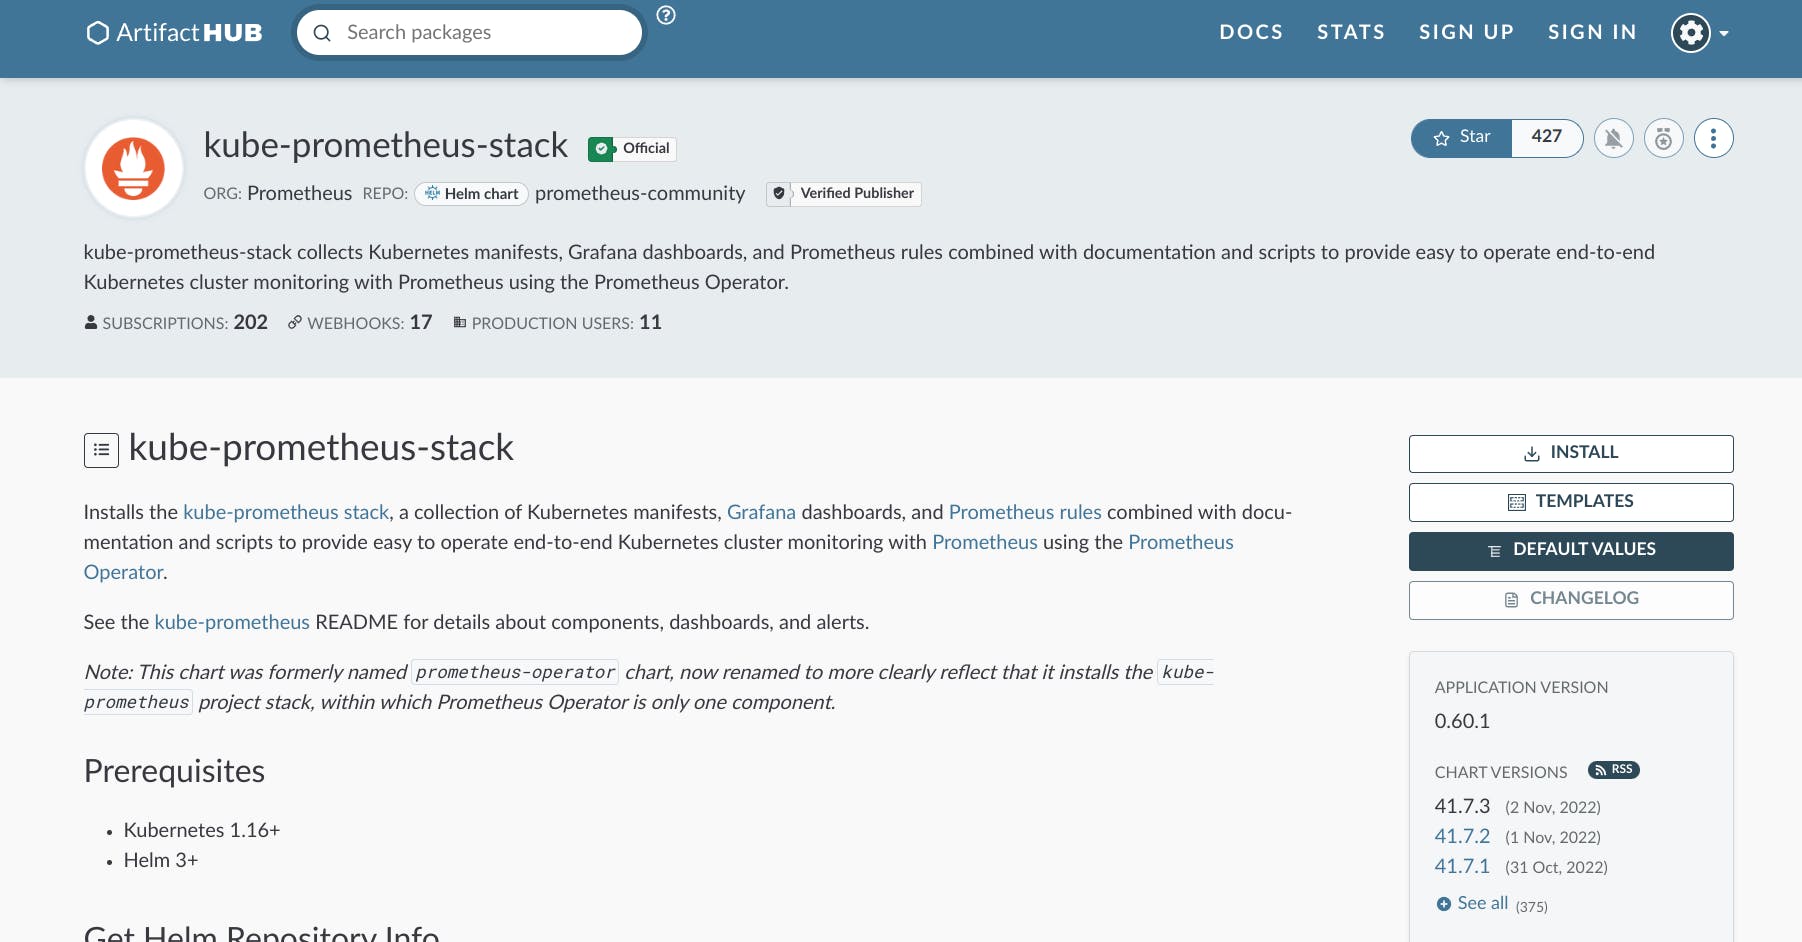
Click on default values, copy and paste what is in that file in a new file on your local machine called ‘values.yml’
helm install kube-prometheus-stack prometheus-community/kube-prometheus-stack -n article -f values.yml
This will install kube-prometheus-stack in the namespace article using the values in values.yml
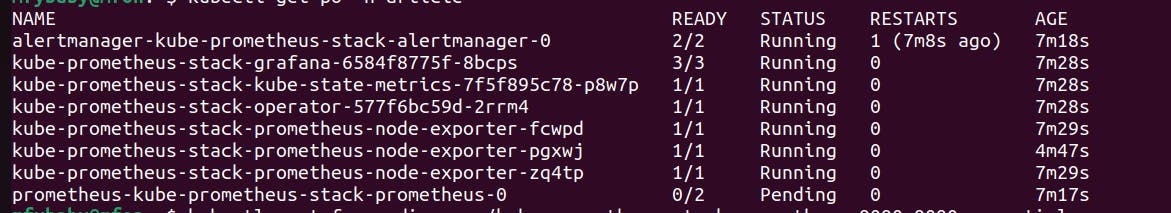
kubectl get po -n article
This will give you the list of pods running in the namespace article
If all is right, you should see something like this
Exploring Prometheus
kubectl port-forward svc/kube-prometheus-stack-prometheus 9090:9090 -n article
Navigate to: localhost:9090
You should be able to see the prometheus web interface.
You can poke around to see the metrics and alerts prometheus can scrape from your kubernetes cluster.
Exploring Alert Manager
kubectl port-forward alertmanager-kube-prometheus-stack-alertmanager-0 9093 -n article
Navigate to: localhost:9093
You should be able to see the alert manager web panel.
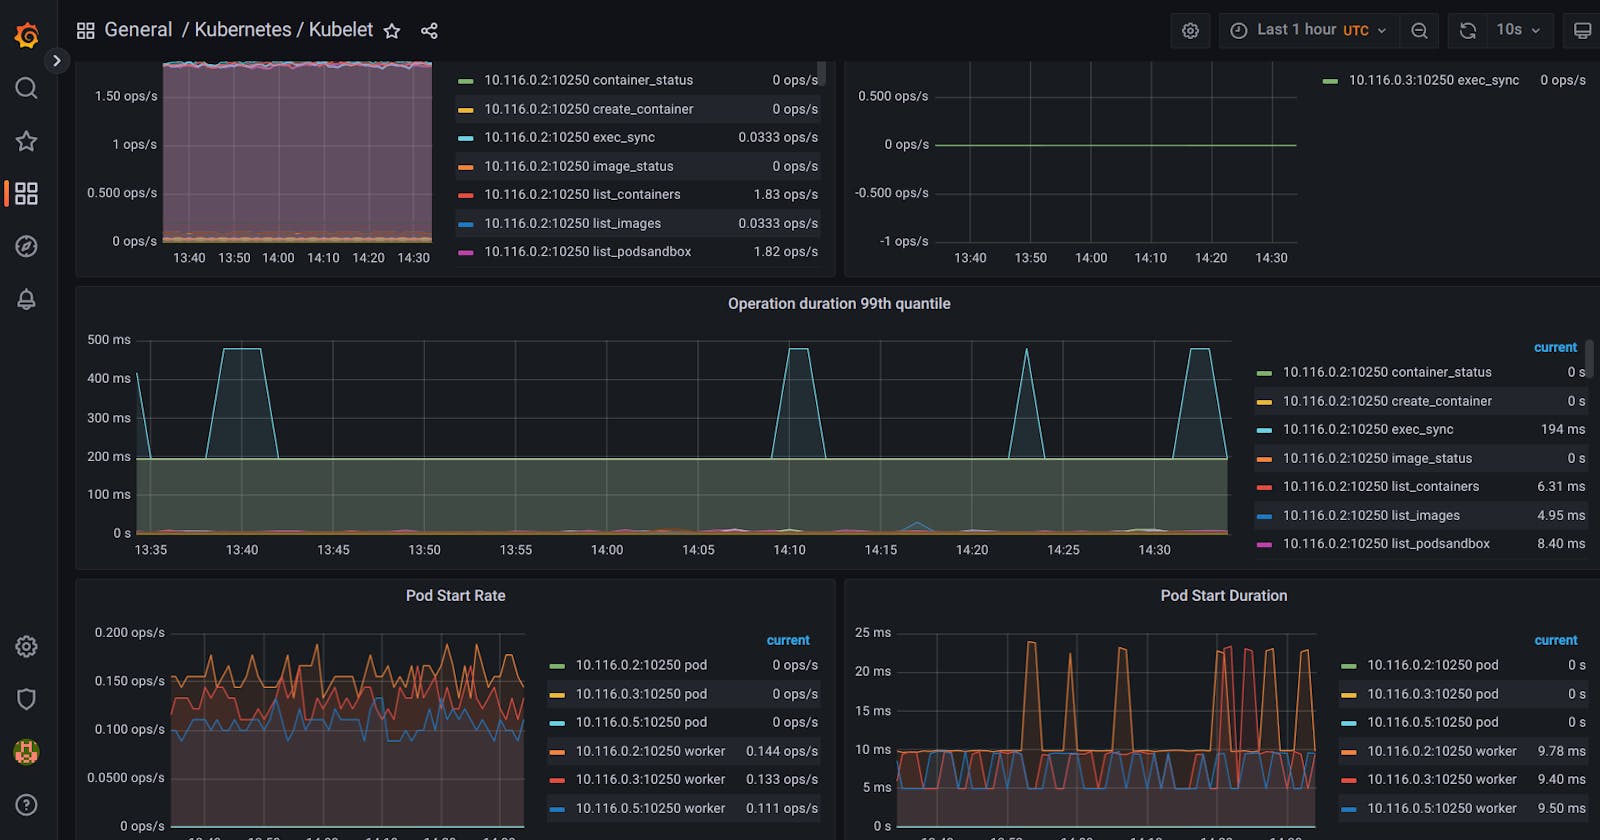
Exploring Grafana
kubectl port-forward svc/kube-prometheus-stack-grafana 3000:80 -n article
This leads you to a Grafana login page. Navigate to: localhost:3000
The default login credentials are:
Username: admin
Password: prom-operator
You can look around to get information about your running cluster.
Conclusion
Monitoring the pods on your Kubernetes cluster is quite beneficial it gives you information on what is going on in your pods. This prevents Site downtime and gives options on what to do when this occurs.